对Grafana云的星号集成
Asterisk是一个用于构建通信应用程序的免费开源框架,由Sangoma赞助。该集成使您能够快速设置Asterisk实例的监视。集成安装了预先构建的仪表板和警报,专门用于监视Asterisk部署。
为Grafana Cloud安装Asterisk集成
在Grafana实例中,单击集成和连接(闪电图标),然后点击安装集成星号瓷砖。
等待集成安装完成,然后按照所示的步骤进行设置Grafana代理自动抓取并发送星号指标到您的云实例。
Asterisk集成的预安装配置
为了使此集成工作,您必须启用嵌入式斯特里斯克的普罗米修斯出口商收集和公开Asterisk的指标。
嵌入式普罗米修斯出口商也需要嵌入式Asterisk HTTP服务器是启用.
当Asterisk http服务器和prometheus导出器都启用时-默认情况下,url上的指标是公开的:http://localhost:8088/metrics
res_prometheus配置示例/etc/asterisk/prometheus.conf
[general] enabled = yes core_metrics_enabled = yes uri = metricshttp_server配置示例/etc/asterisk/http_additional.conf
[general] enabled=yes enablestatic=yes bindaddr=0.0.0.0 bindport=8088 prefix= sessionlimit=100 session_inactivity=30000 session_keep_alive=15000更新配置后-确保重启Asterisk服务器Sudo systemctl restart星号然后检查Asterisk服务器的状态Sudo systemctl status星号最后登录Asterisk命令行,以确保其运行Sudo星号-r
这些指标应该由嵌入的prometheus出口商在url上公开http://localhost:8088/metrics
Asterisk集成的安装后配置
在代理配置文件中,必须将代理指向服务器,例如星号:8088在下面的示例中,它公开了一个/指标端点由嵌入的Asterisk prometheus出口商。同样在日志配置中,必须将代理配置为从Asterisk“完整”日志文件收集日志,如下例所示。
Metrics: wal_directory: /tmp/wal global: scrape_interval: 5s configs:—name: integrations remote_write:—url: http://cortex:9009/api/prom/push scrape_configs:—job_name: integrations/ asterdisk -prom static_configs:—targets: ['localhost:8088'] logs: configs:—name: agent clients:—url: http://loki:3100/api/prom/push positions: filename: /tmp/positions. properties: ['localhost:8088']Yaml target_config: sync_period: 10s scrape_configs: - job_name: integrations/asterisk-logs static_configs: - targets: ['localhost'] labels: job: integrations/asterisk-logs __path__: /var/log/asterisk/full指示板
该集成包括两个仪表板。
星号概述
这个仪表板根据Asterisk中嵌入的prometheus导出器公开的所有指标给出了Asterisk实例的总体概述。
概述

渠道信息
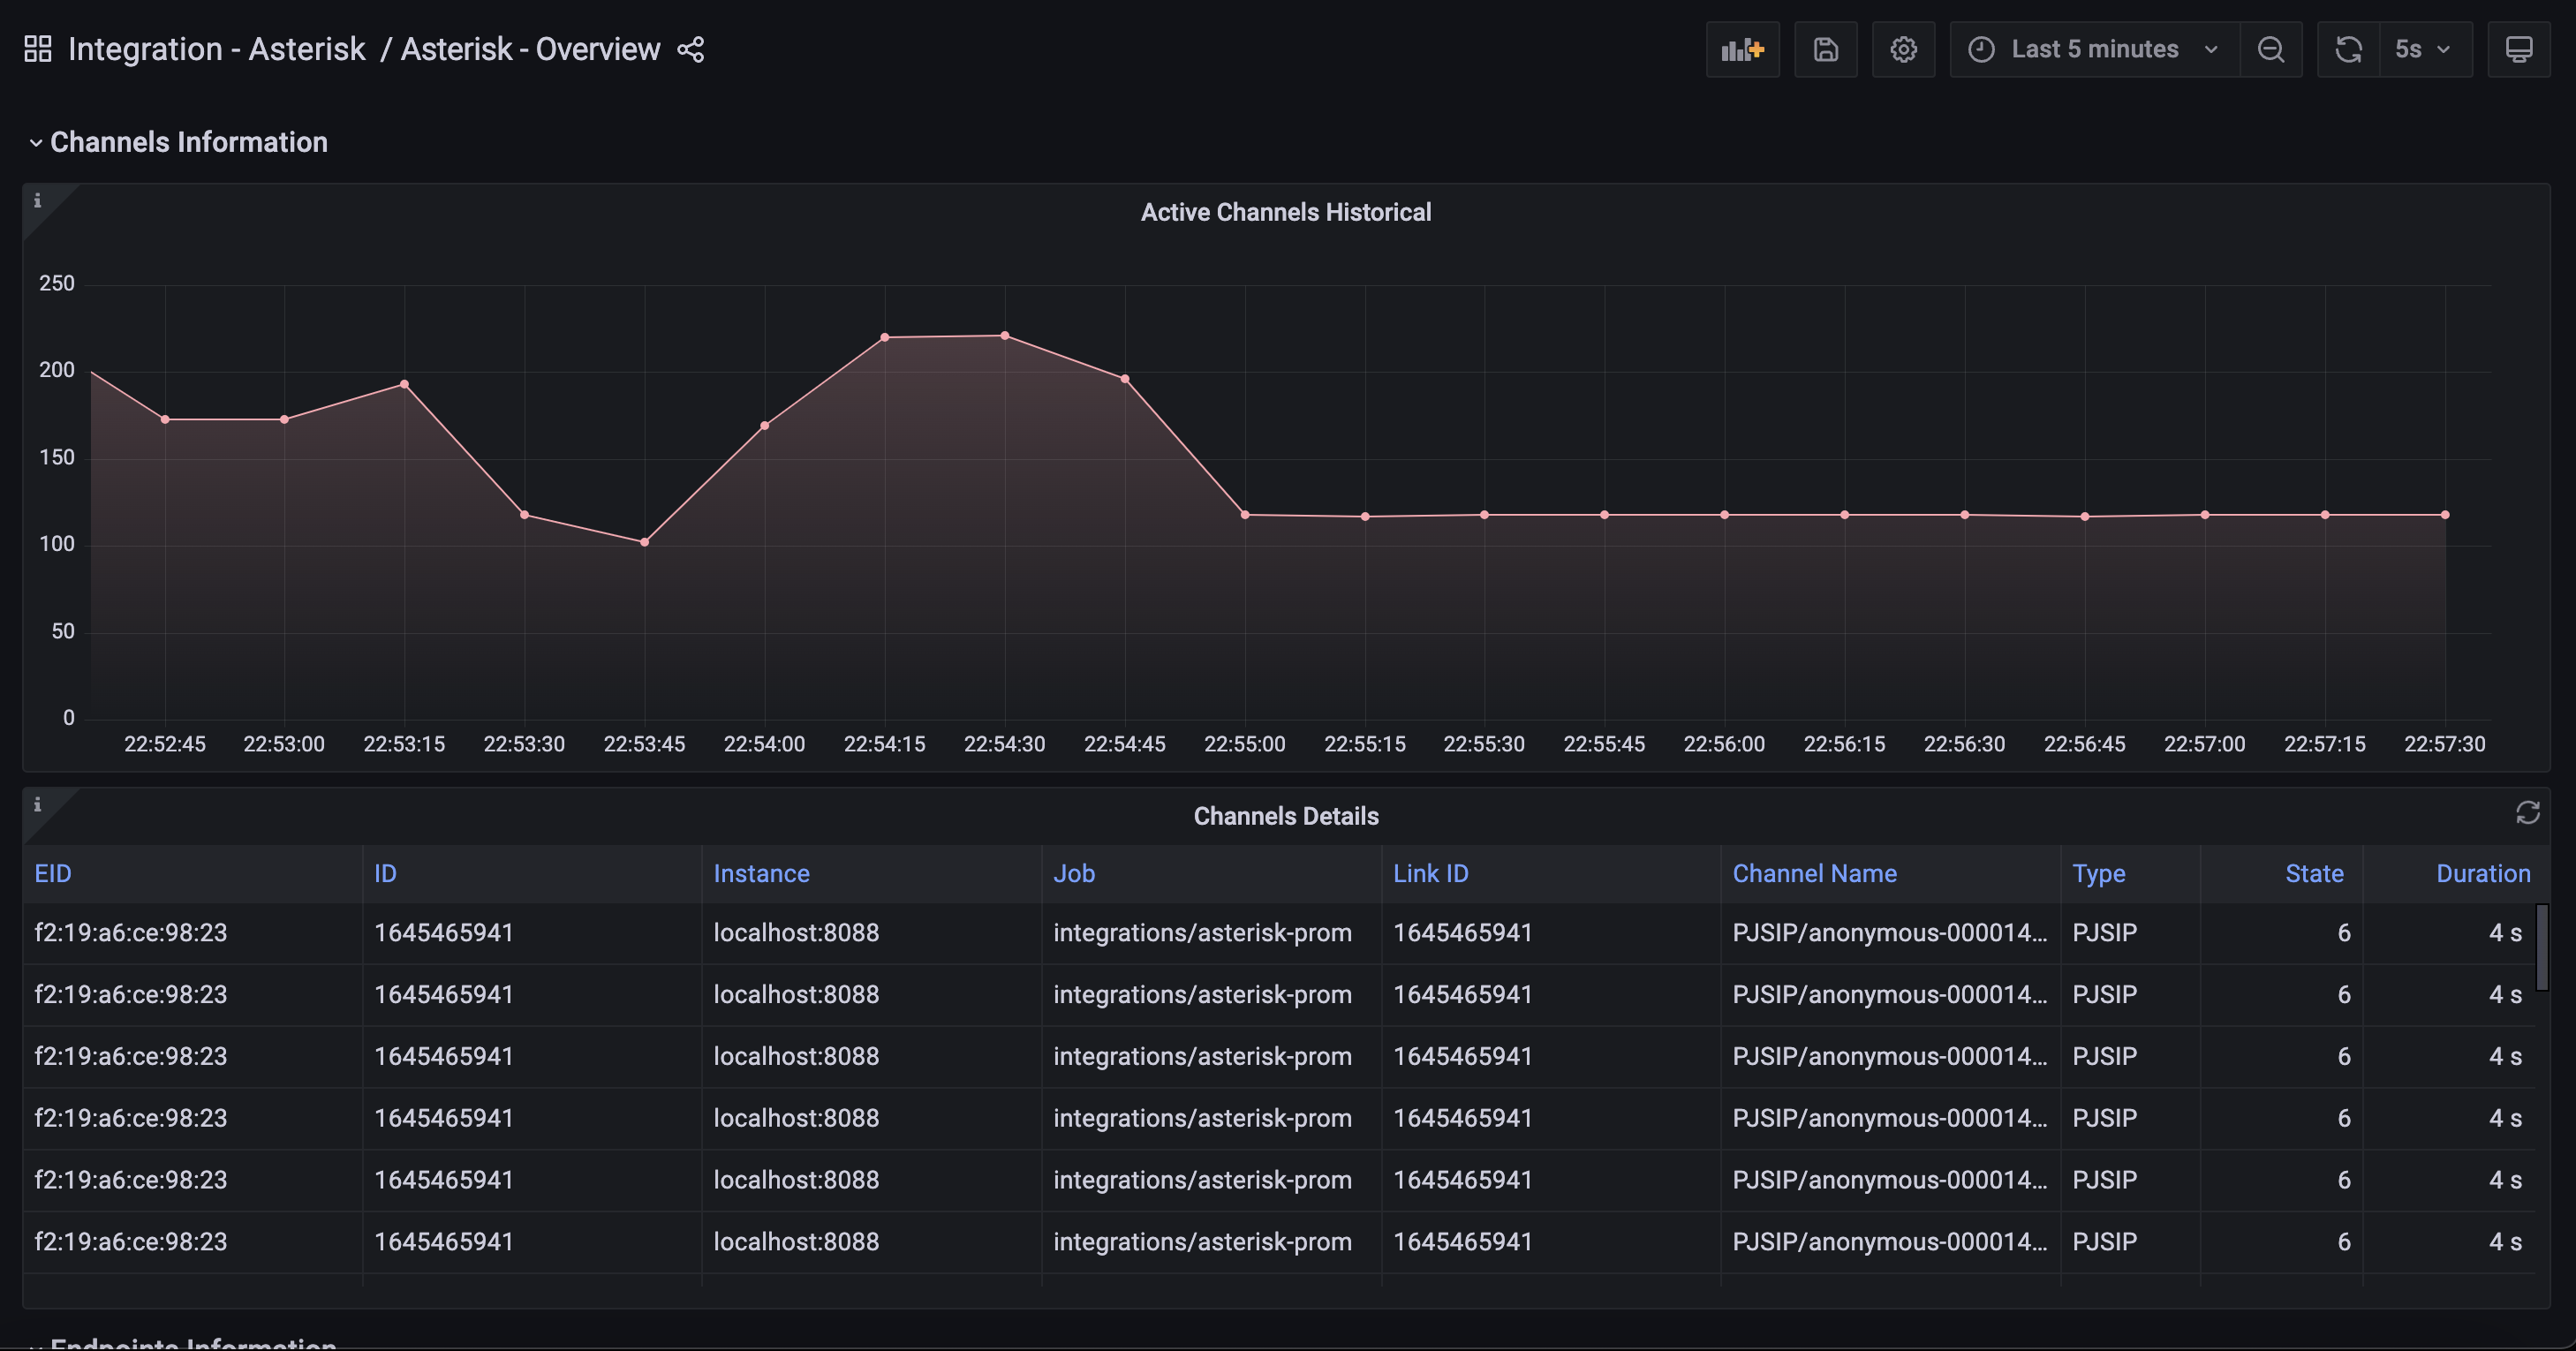
端点信息

桥梁信息

星号系统信息

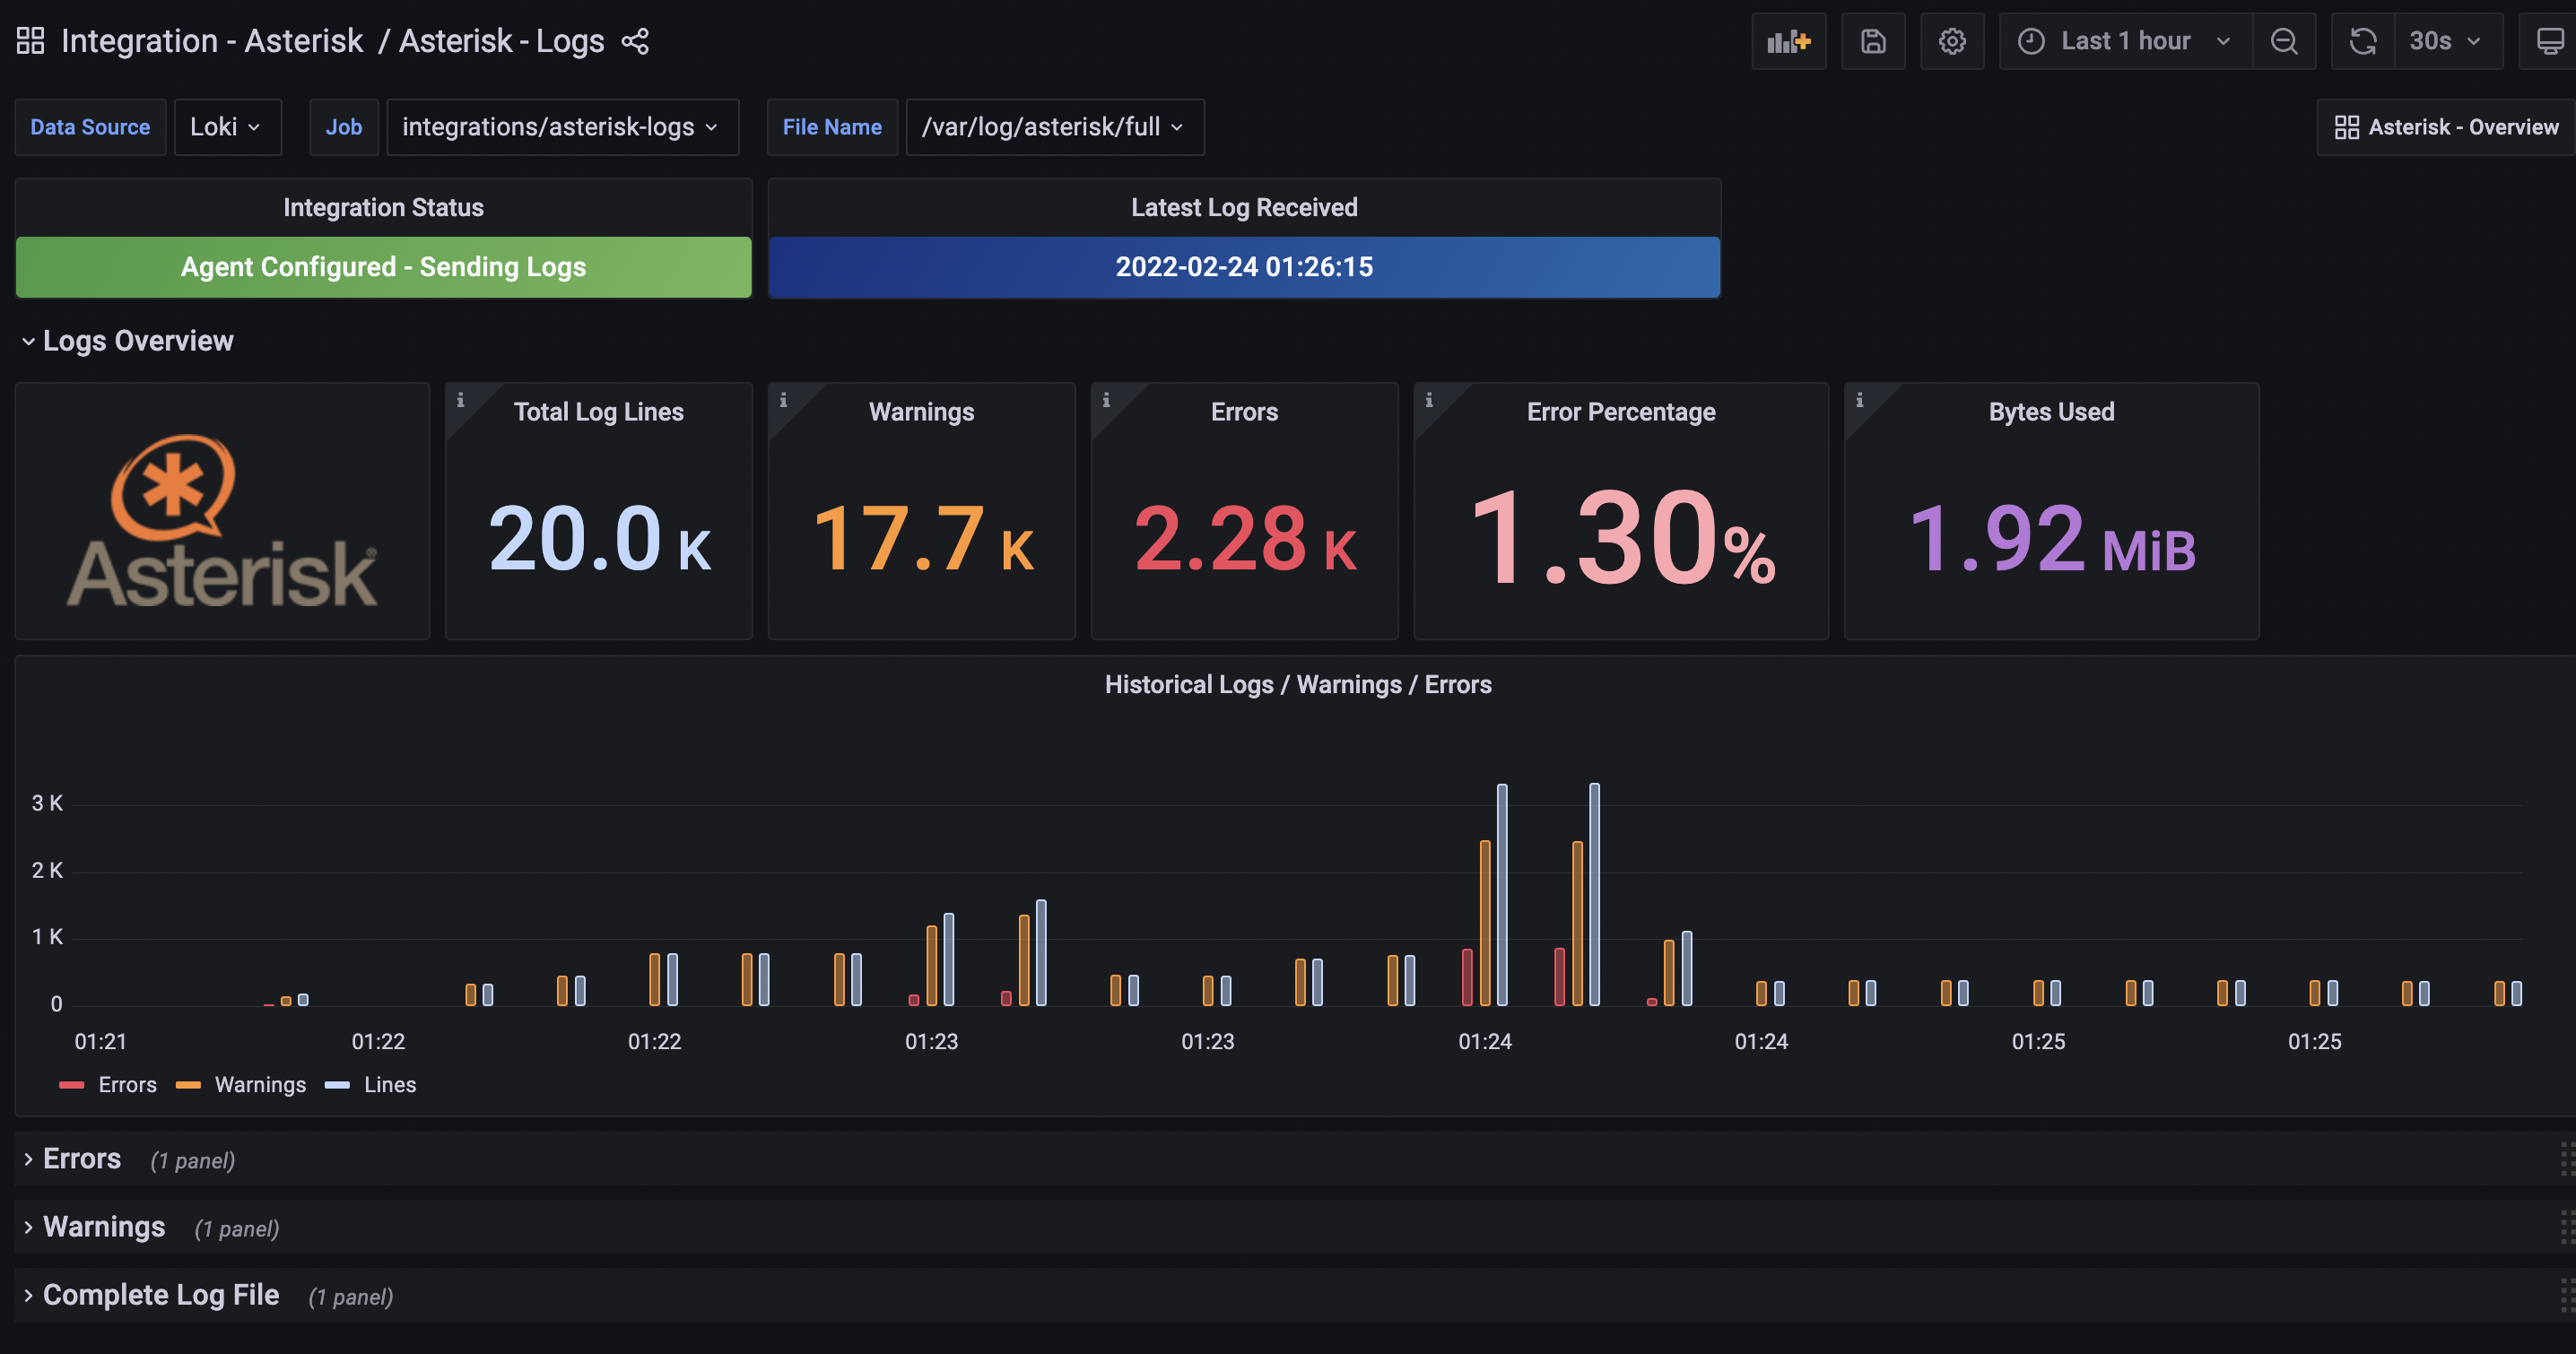
星号日志这个仪表板提供关于Asterisk日志文件的指标和详细信息。目前只有主Asterisk日志文件/var/log/asterisk/full都在仪表盘上。
仪表板包含多个部分,如下所示:
日志概述
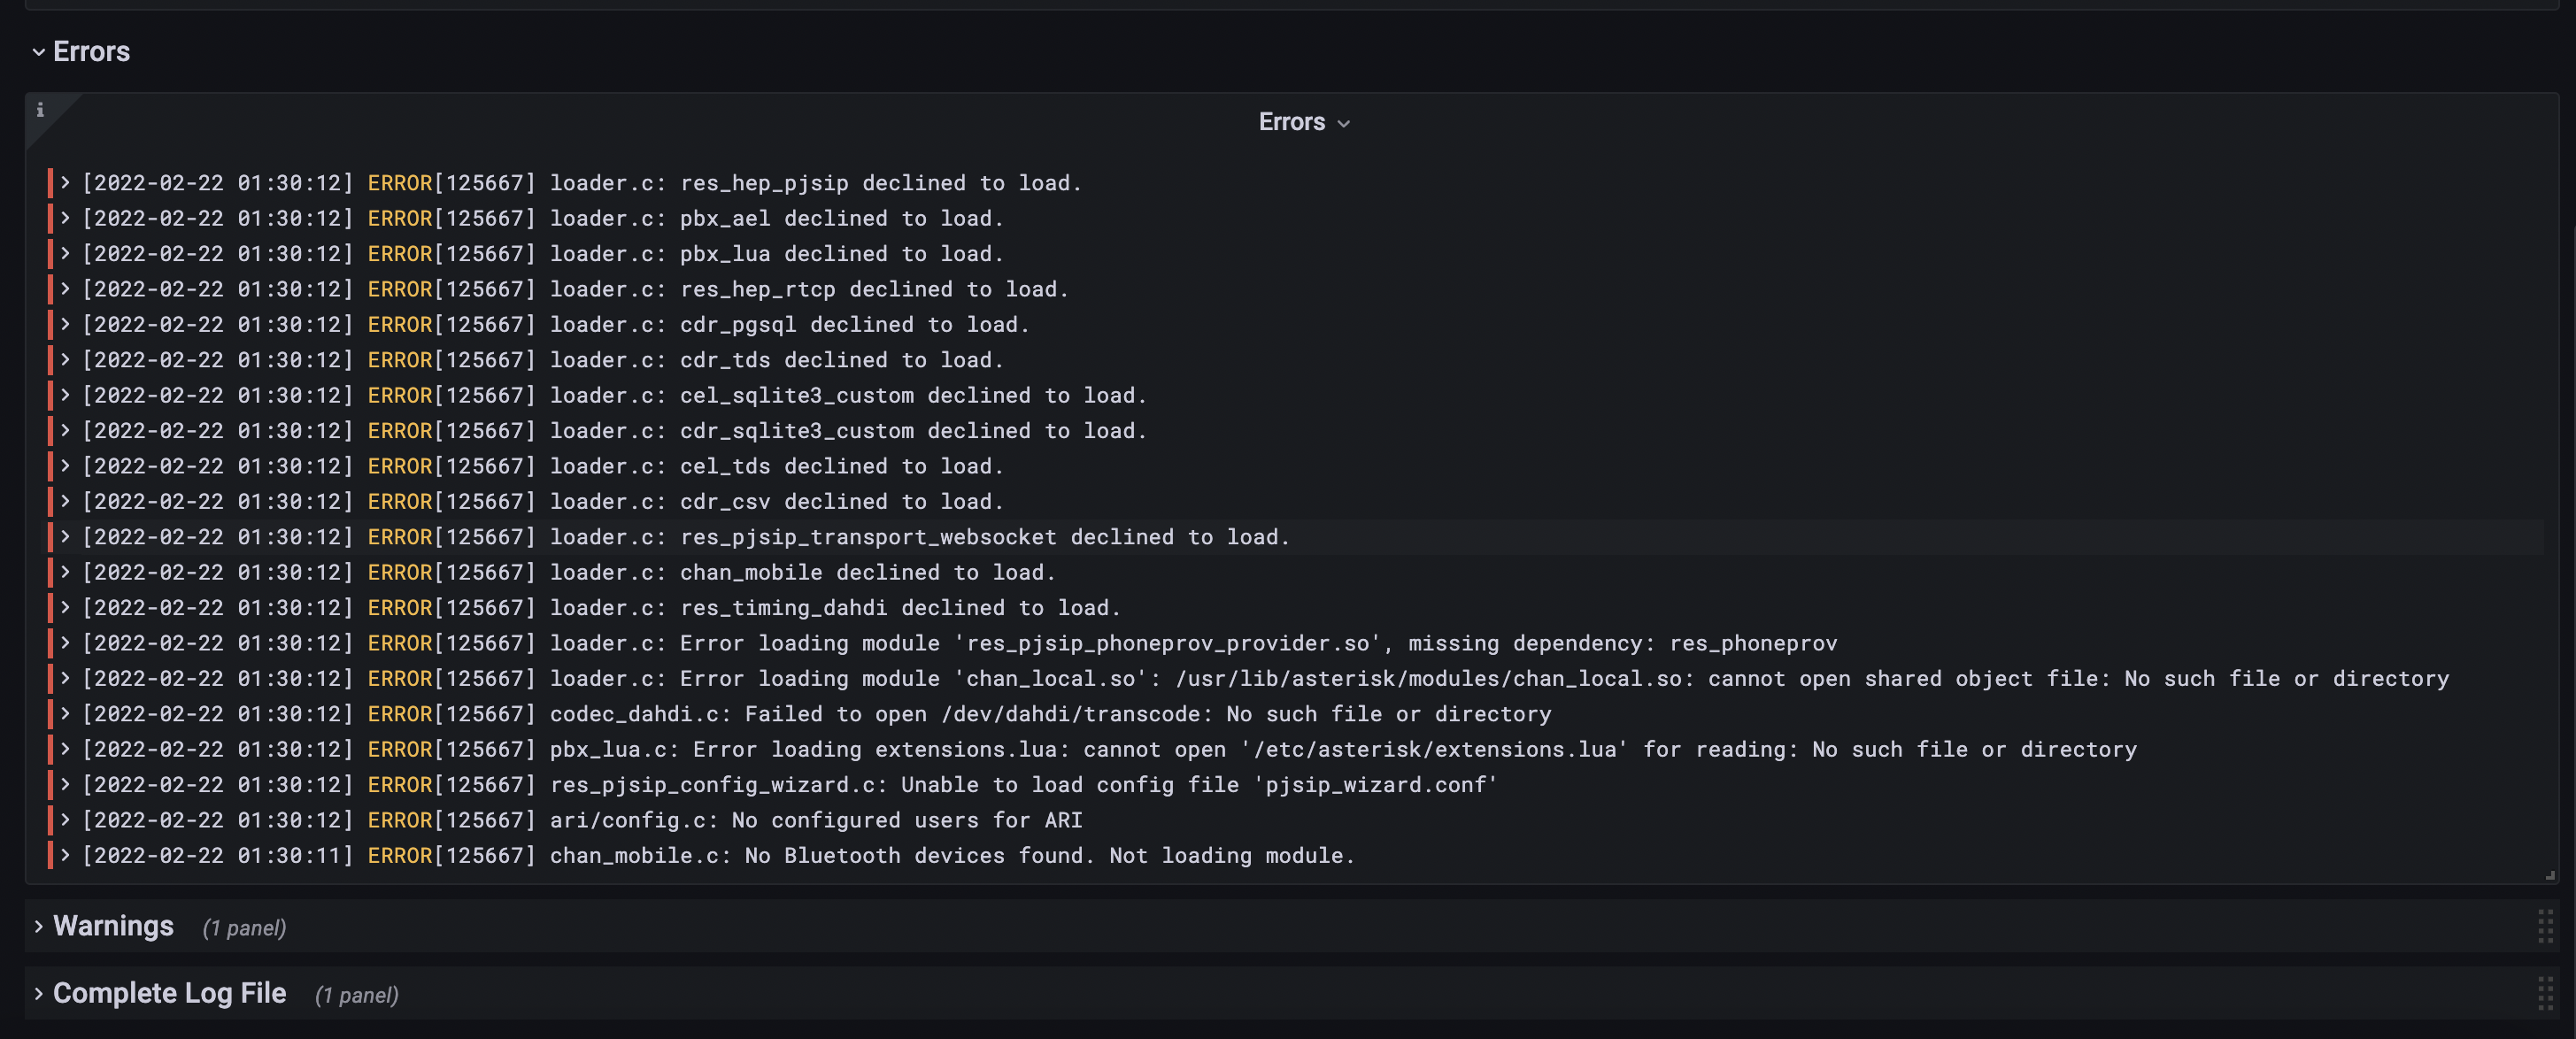
错误
警告

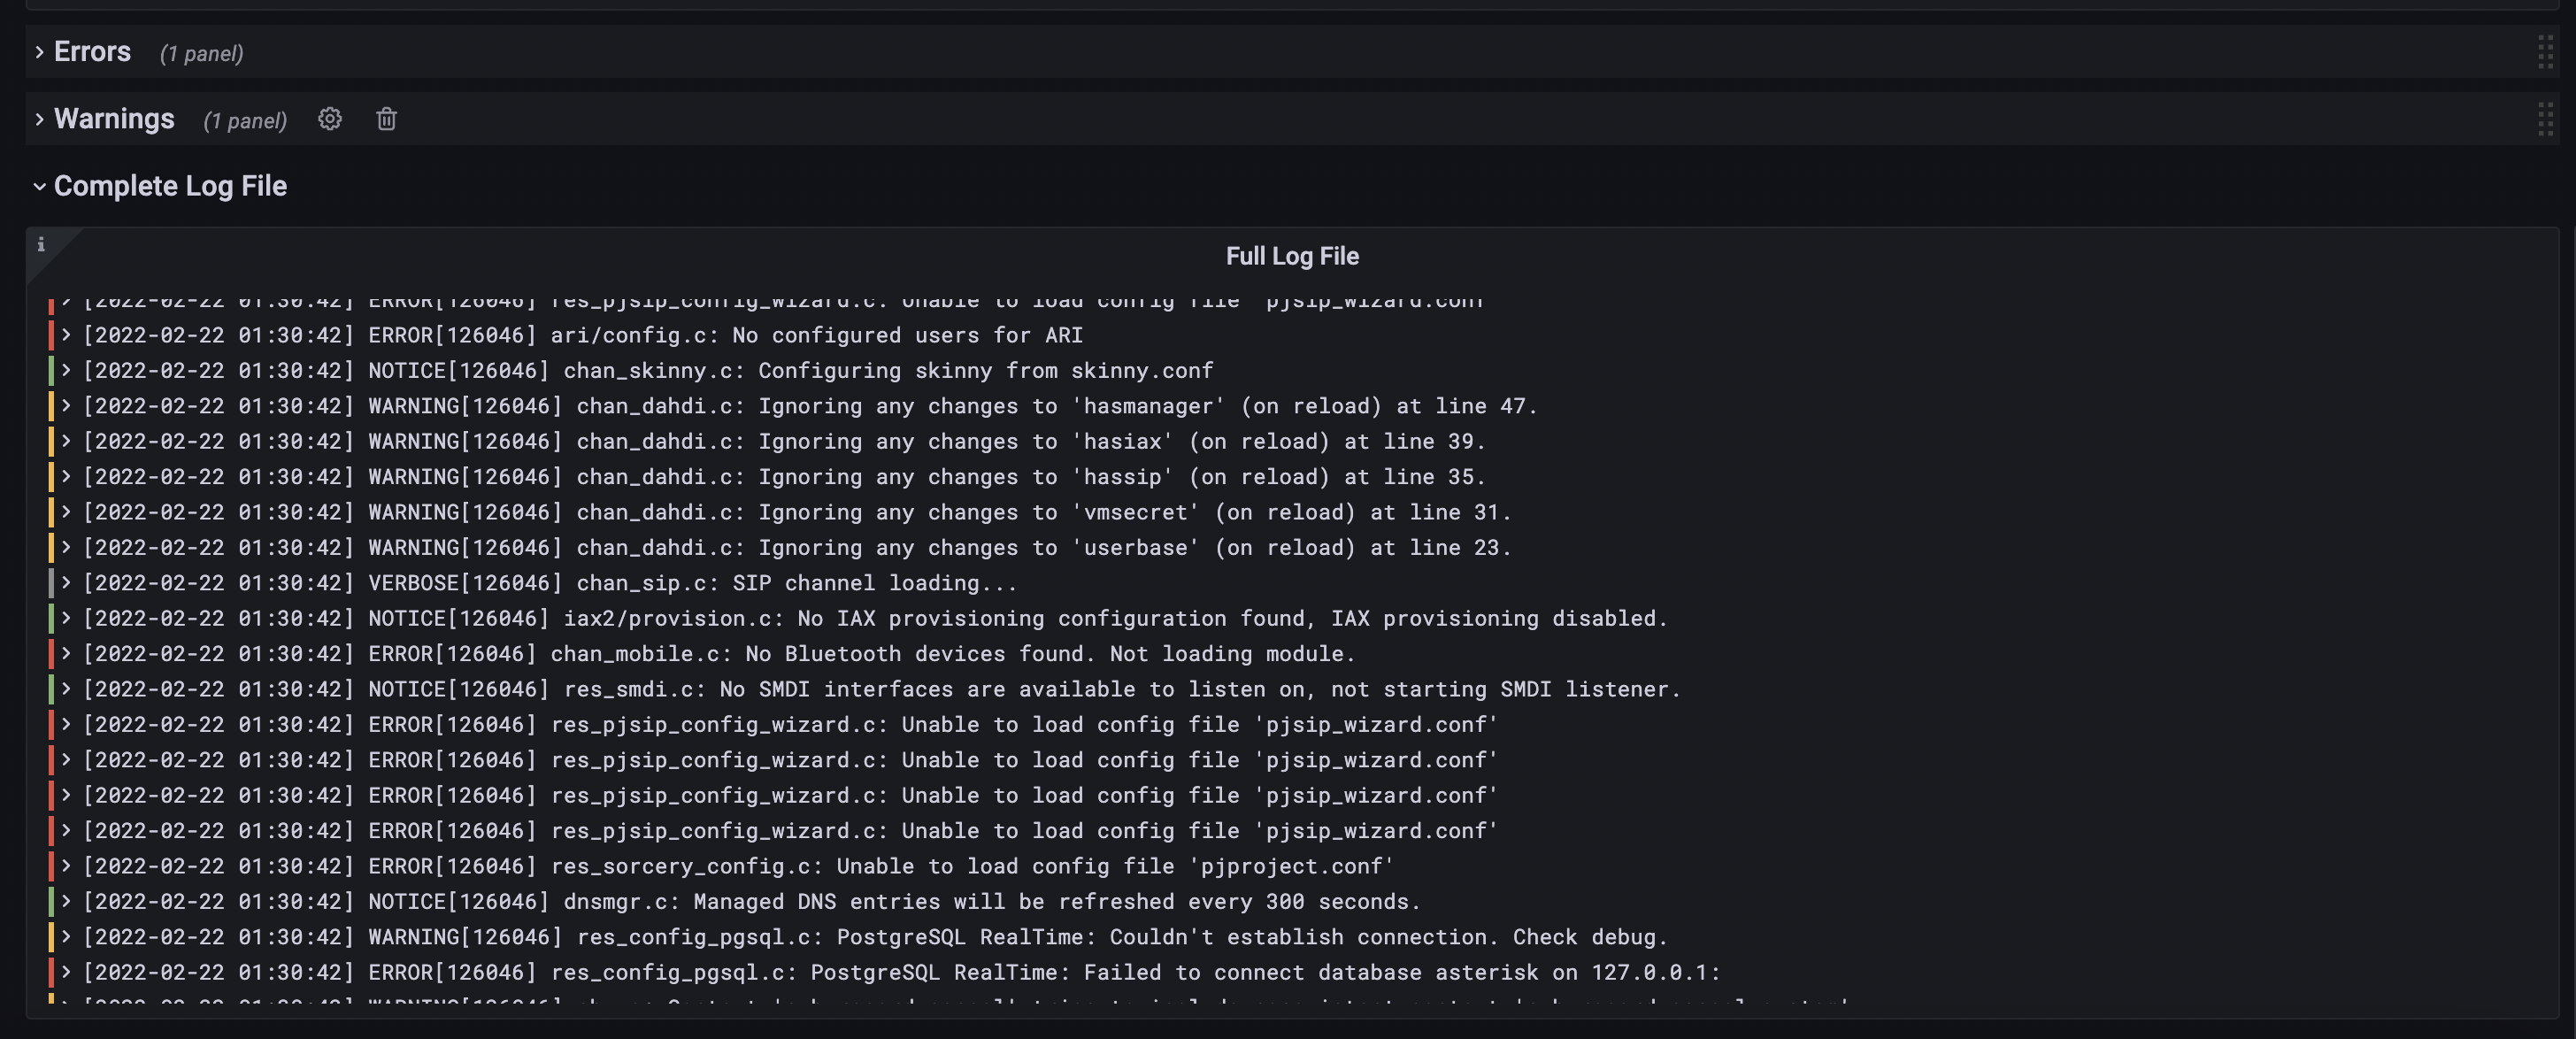
完整日志文件
仪表板的链接在仪表板的右上角,您会发现一个链接,可以在两个仪表板之间快速切换,同时保持时间范围选择不变
指标
下面是连接Asterisk实例时自动写入到Grafana Cloud实例的每个服务的指标列表。
- asterisk_channels_count
- asterisk_calls_sum
- asterisk_calls_count
- asterisk_channels_state
- asterisk_channels_duration_seconds
- asterisk_endpoints_count
- asterisk_endpoints_state
- asterisk_endpoints_channels_count
- asterisk_bridges_count
- asterisk_core_properties
- asterisk_core_uptime_seconds
- asterisk_core_last_reload_seconds
- asterisk_core_scrape_time_ms
这文件显示由Asterisk实例的导出器公开的示例度量。
警报
该集成还附带了许多方便的警报。
AsteriskRestarted
该警报监视asterisk_core_uptime_seconds度量,并在最近60秒内重新启动系统时发出警报。这可以是计划重新启动,也可以是由于某些异常或失败而重新启动。
AsteriskReloaded
该警报监视asterisk_core_last_reload_seconds度量,并在最近60秒内重新加载系统时发出警报。
> 100ms(用户可设置)
Asterisk prometheus导出器公开了一个名为asterisk_core_scrape_time_ms的度量值,它是导出器收集Asterisk数据所需的时间(以毫秒为单位)。擦除时间过长会导致系统性能下降。这个值通常应该非常低,所以如果刮擦时间超过100ms,就会触发该警报。
AsteriskHighActiveCallsCount > 100(用户可设置)
Asterisk部署的容量因环境而异,但是可以将此警报配置为对系统上异常高的活动呼叫计数发出警报。
成本
通过连接你的Asterisk实例到Grafana Cloud,你可能会招致费用。若要查看有关Grafana Cloud帐户用于每个云层中包含的指标的活动系列数量的信息,请参见活动系列和dpm使用而且云层定价.
相关Grafana云资源
介绍普罗米修斯和格拉夫娜云
普罗米修斯要接管监控世界了!在这次网络研讨会上,我们将首先简要介绍开源项目,它是监控现代云原生系统的实际标准。
如何用Grafana Cloud建立和可视化大规模的综合监控
在这个GrafanaCONline会话中,学习如何使用Kubernetes、Grafana Loki和Grafana Cloud的合成监控功能来设置基础设施的检查。
使用Grafana Cloud来驱动制造工厂的效率
GrafanaCONline课程讲述了Grafana如何帮助一家拥有75年历史的制造公司提高产品质量和维护设备。